
video here
Similar Posts
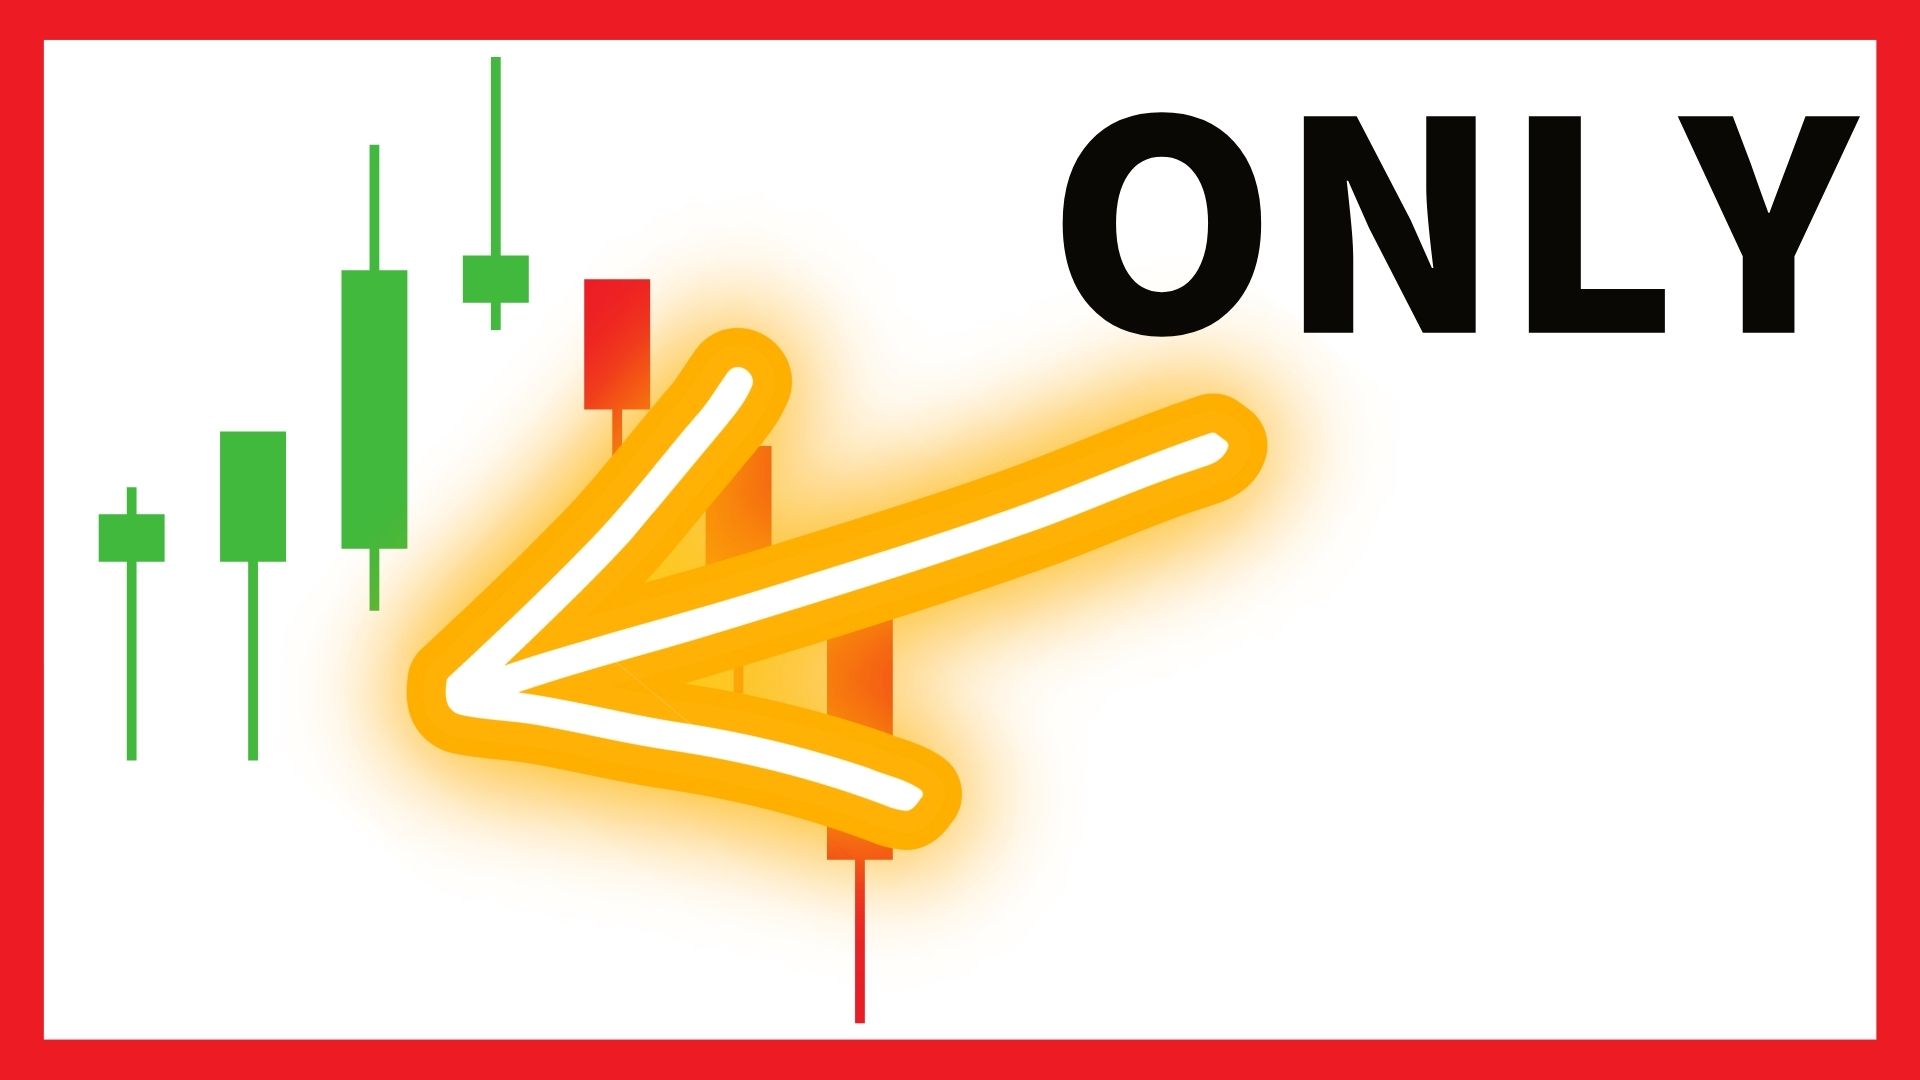
Find bigger Candlestick body and inside close price
Find bigger Candlestick body and inside close price Reader’s message —————— Hello Long This strategy would be very suitable for me ! But as you can see on this picture, I see far more loosing trades than winning ones (red arrows = entry candles, loosing / green arrows = entry candles, winning). Of course…
I will follow every time or give me some tips
I will follow every time or give me some tips reader’s message ——————— Sir, I see your all video, but i am confused from there. sir would you mind please advice me which candlestick pattern i will follow every time or give me some tips about profitable candlestick pattern with some picture. ——————— click here…
CFD Hong Kong 33 Candlestick
CFD Hong Kong 33 Candlestick Candlestick Pattern Karakasa Karakasa means Umbrella. Closing price is higher than the opening price. It shows a turning point of the market, rise sign that will appear in the lows. It shows pullback that will appear in the highs this means high possibility turn to the decline in the…
What are the best hours to Trade Forex
here is reader’s quetion———————Hello sirHow are you?I am facing too much problem with overtrading one day if i get profit , i trade again and again after some time the profitwill loose and then loss starts one day if I lose, I trade again and again , that day too much loss. please make one…